
Server Timing Plugin
This plugin adds support for auditing performance bottlenecks with Server Timing API
Install with:
bun add @elysia/server-timingThen use it:
import { Elysia } from 'elysia'
import { serverTiming } from '@elysia/server-timing'

new Elysia()
    .use(serverTiming())
    .get('/', () => 'hello')
    .listen(3000)
Server Timing will then append the 'Server-Timing' header with log duration, function name, and detail for each life-cycle function.
To inspect, open browser developer tools > Network > [Request made through Elysia server] > Timing.
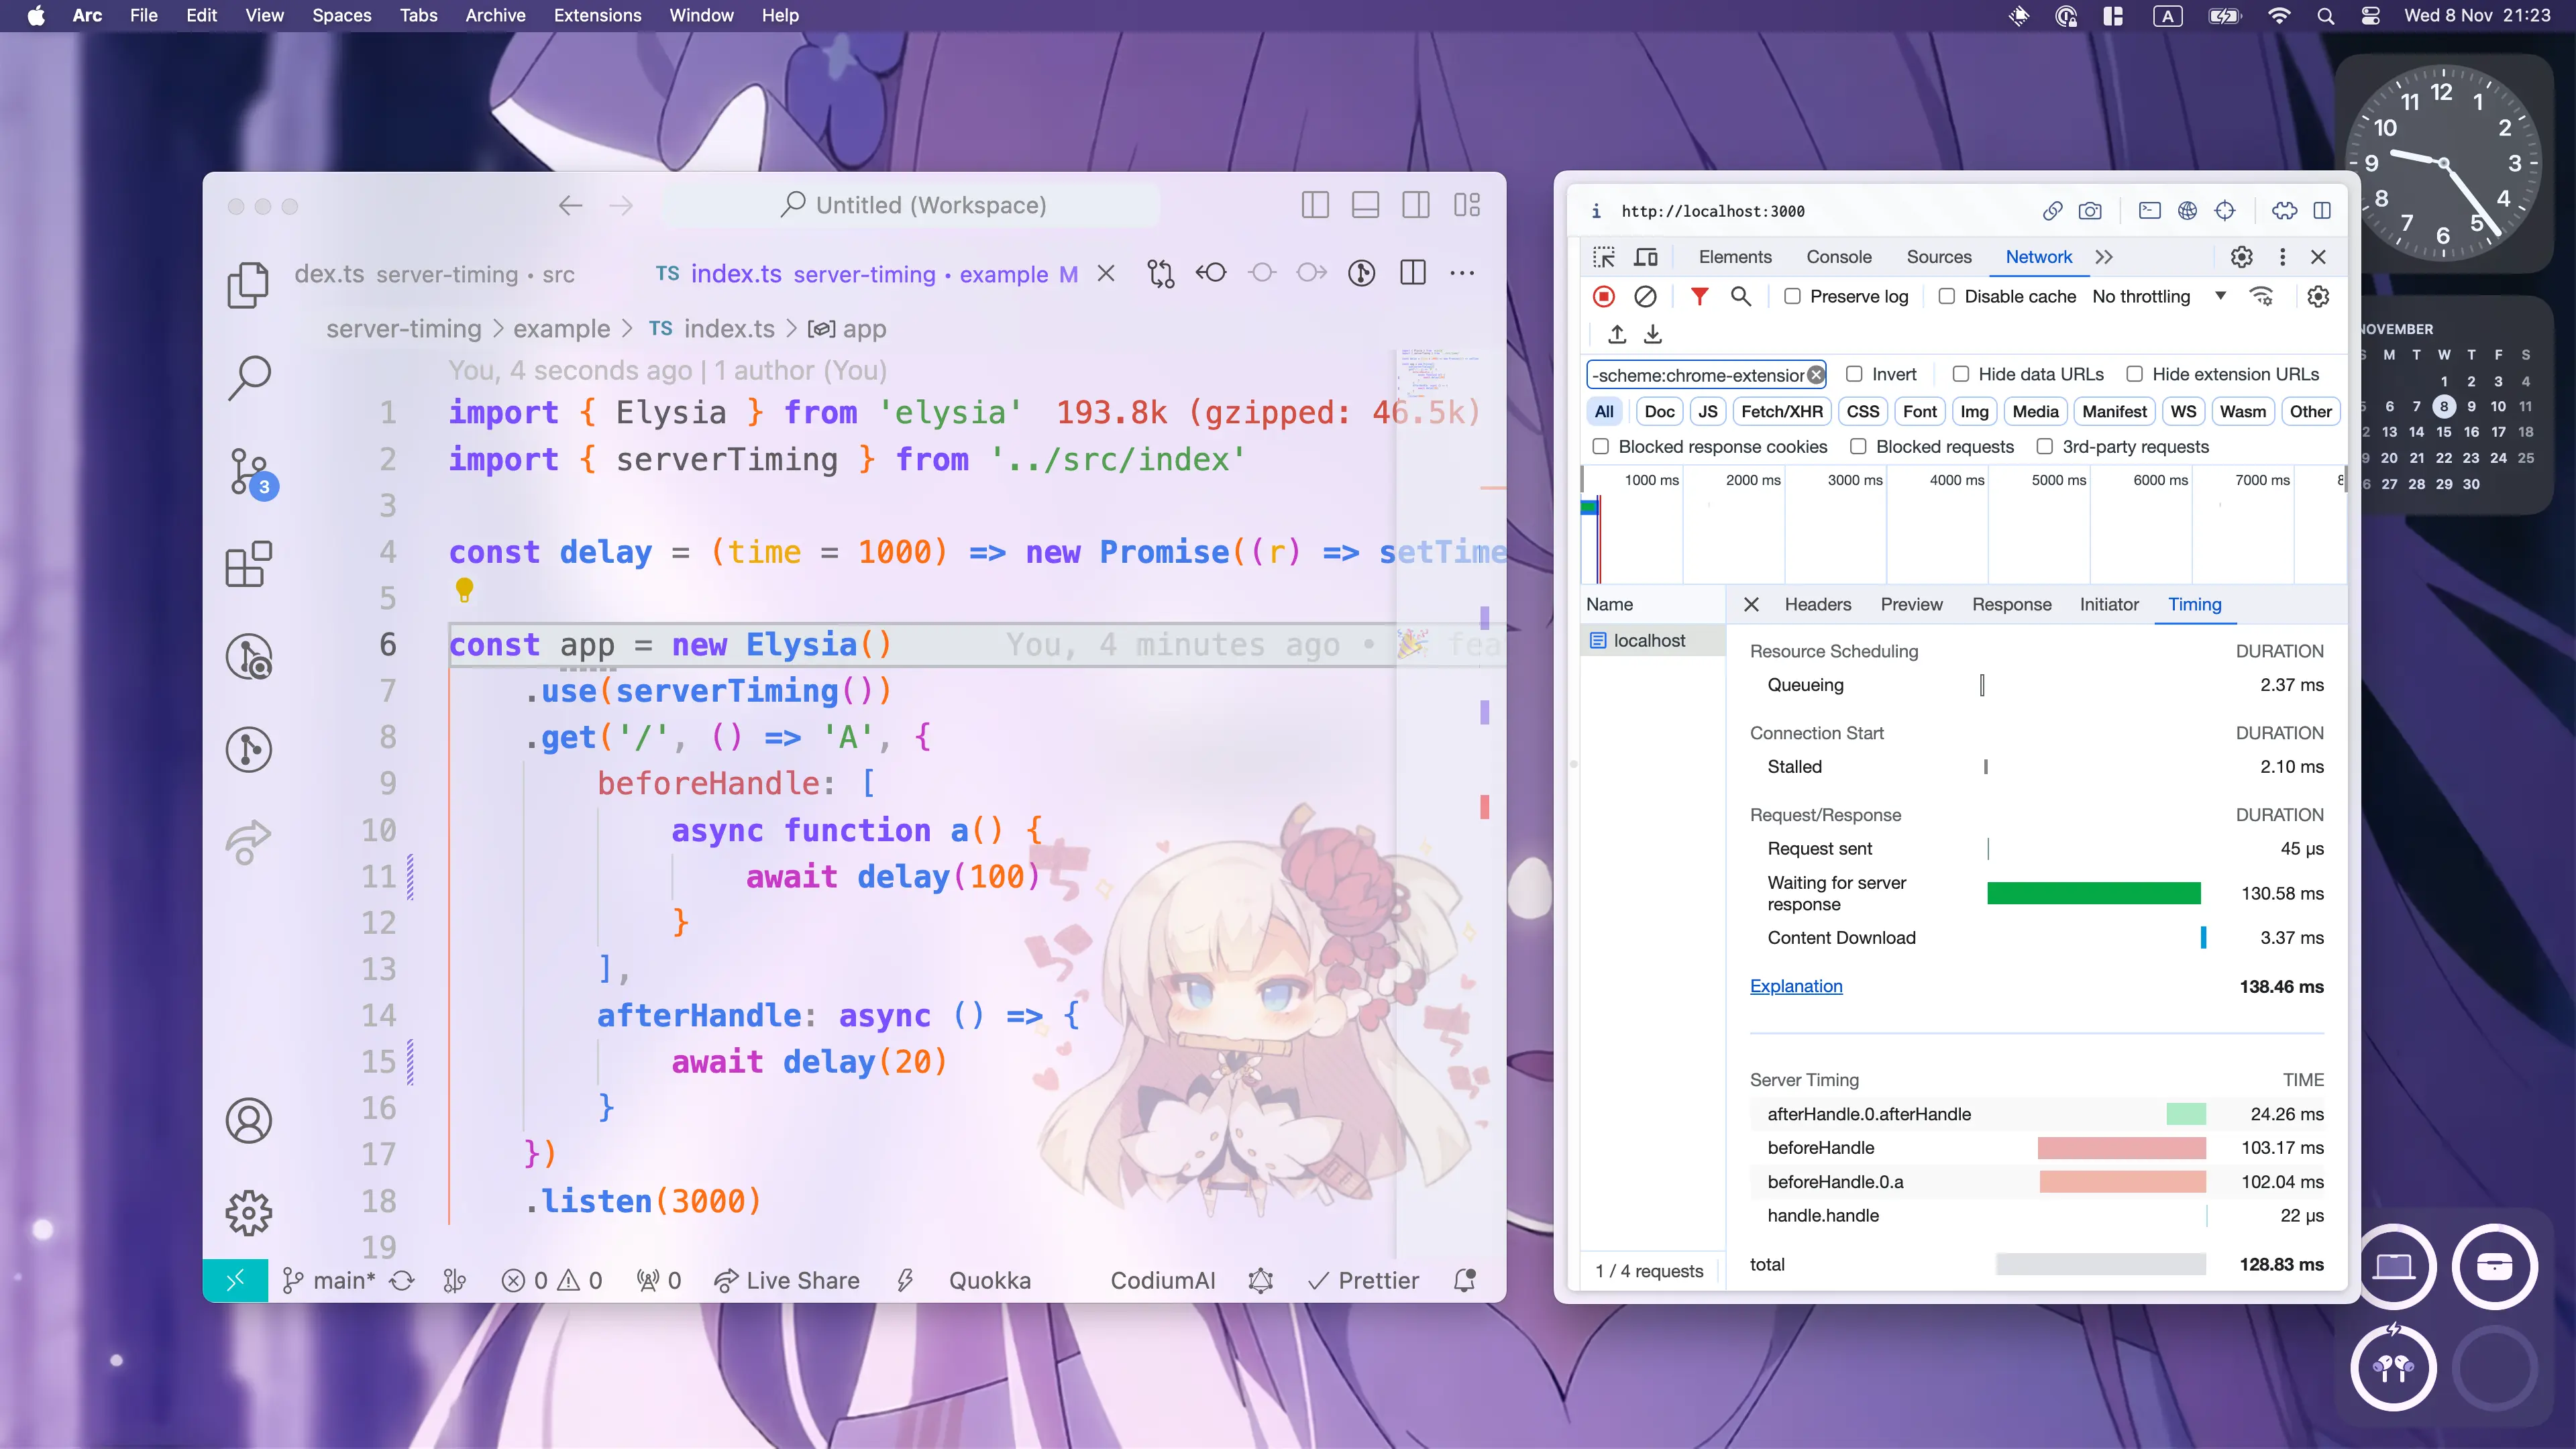
Now you can effortlessly audit the performance bottleneck of your server.
Config
Below is a config which is accepted by the plugin
enabled
@default NODE_ENV !== 'production'
Determine whether or not Server Timing should be enabled
allow
@default undefined
A condition for whether server timing should be logged
trace
@default undefined
Allow Server Timing to log specified life-cycle events:
Trace accepts objects of the following:
- request: capture duration from request
- parse: capture duration from parse
- transform: capture duration from transform
- beforeHandle: capture duration from beforeHandle
- handle: capture duration from the handle
- afterHandle: capture duration from afterHandle
- total: capture total duration from start to finish
Pattern
Below you can find the common patterns to use the plugin.
Allow Condition
You may disable Server Timing on specific routes via allow property
import { Elysia } from 'elysia'
import { serverTiming } from '@elysia/server-timing'

new Elysia()
    .use(
        serverTiming({
            allow: ({ request }) => {
                return new URL(request.url).pathname !== '/no-trace'
            }
        })
    )