
Trace
Trace is an API to measure the performance of your server.
Trace allows us to interact with the duration span of each life-cycle events and measure the performance of each function to identify performance bottlenecks of the server.
Performance is an important aspect for Elysia.
We don't want to be fast for benchmarking purposes, we want you to have a real fast server in real-world scenario.
There are many factors that can slow down our app - and it's hard to identify them, but trace can helps solve that problem
Trace
Trace can measure life cycle execution time of each function to audit the performance bottleneck of each cycle.
import { Elysia } from 'elysia'

const app = new Elysia()
    .trace(async ({ handle }) => {
        const { time, end } = await handle

        console.log('beforeHandle took', (await end) - time)
    })
    .get('/', () => 'Hi')
    .listen(3000)
You can trace life cycle of the following:
- request - get notified of every new request
- parse - array of functions to parse the body
- transform - transform request and context before validation
- beforeHandle - custom requirement to check before the main handler, can skip the main handler if response returned.
- handle - function assigned to the path
- afterHandle - map returned value into a proper response
- error - handle error thrown during processing request
- response - send a Response back to the client
Please refer to Life Cycle Events for more information: 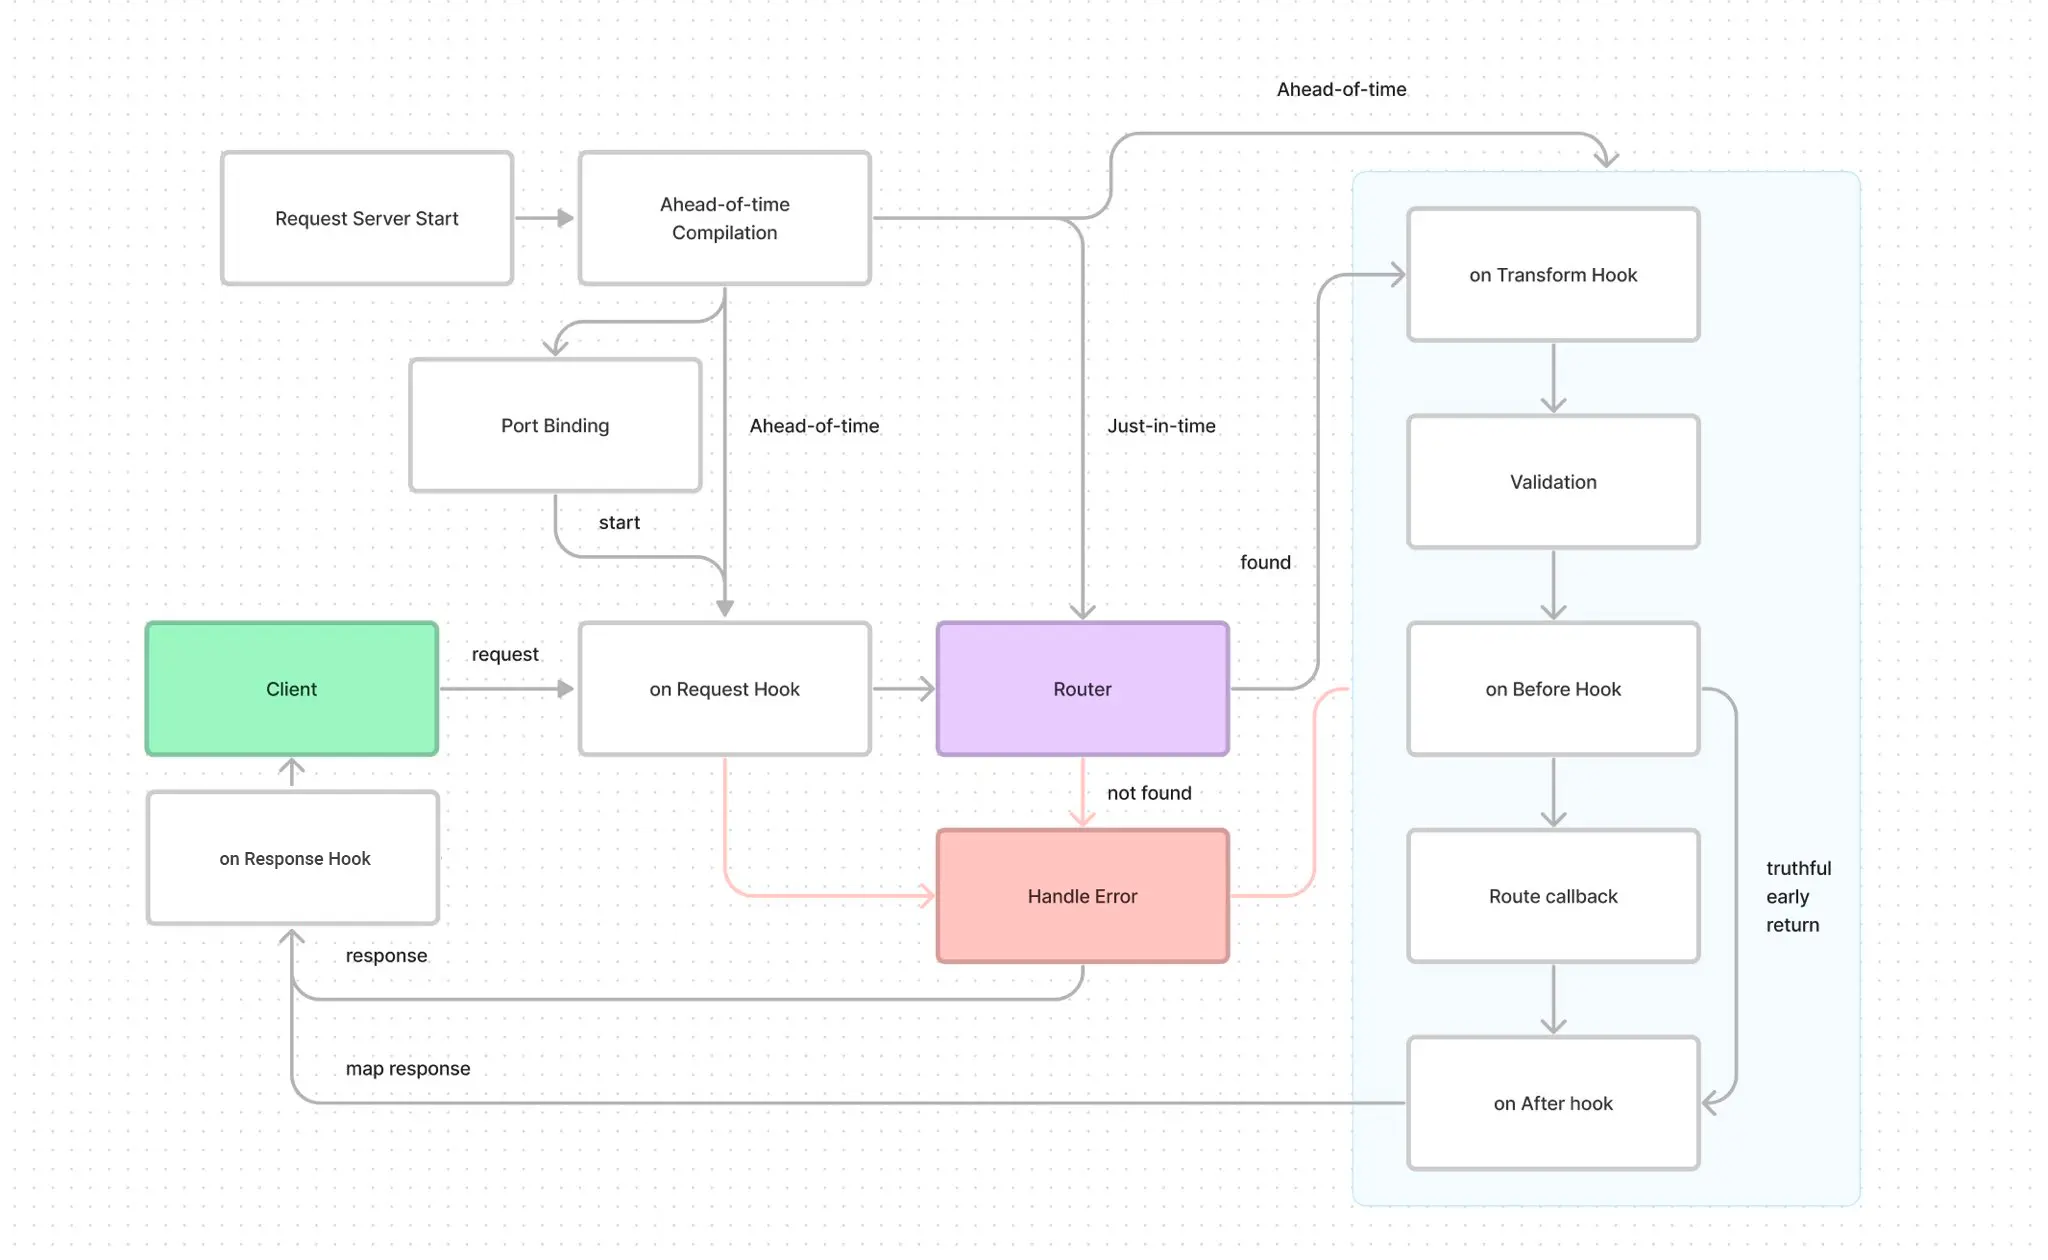
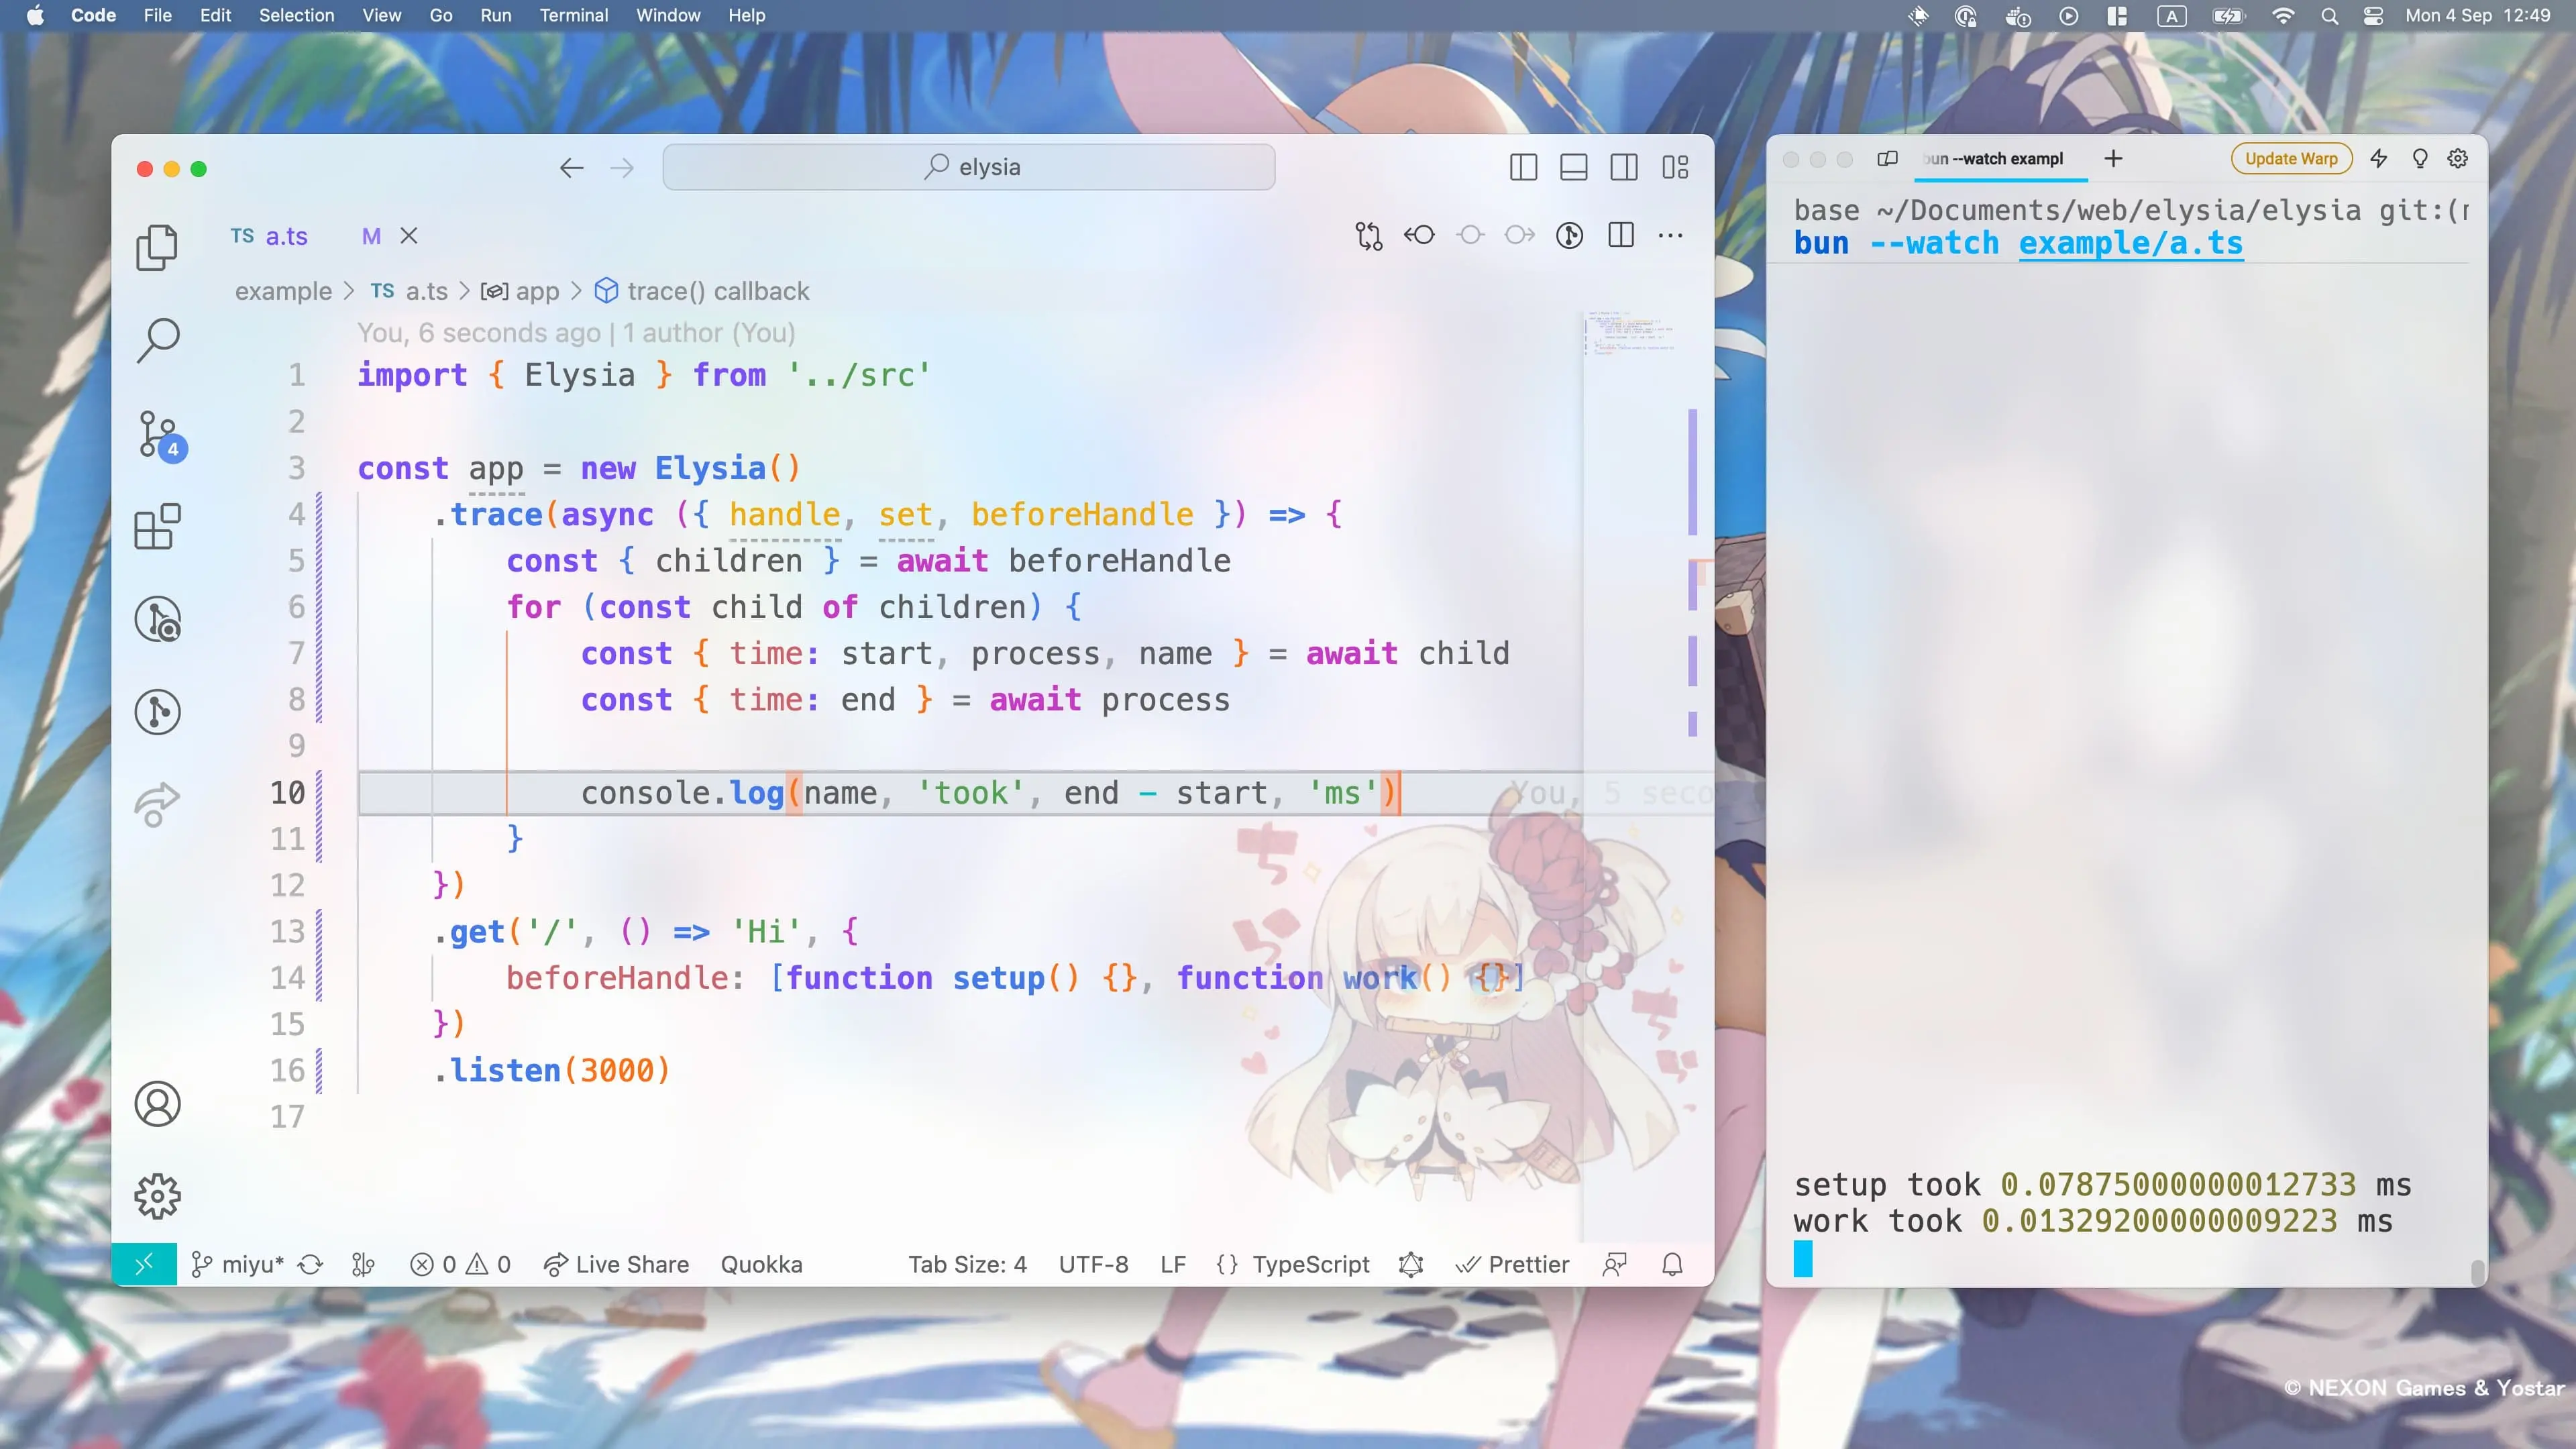
Children
You can tap deeper and measure each function of a life-cycle event by using the children property of a life-cycle event
import { Elysia } from 'elysia'

const sleep = (time = 1000) =>
    new Promise((resolve) => setTimeout(resolve, time))

const app = new Elysia()
    .trace(async ({ beforeHandle }) => {
        const { children } = await beforeHandle

        for (const child of children) {
            const { time: start, end, name } = await child

            console.log(name, 'took', (await end) - start, 'ms')
        }
    })
    .get('/', () => 'Hi', {
        beforeHandle: [
            function setup() {},
            async function delay() {
                await sleep()
            }
        ]
    })
    .listen(3000)
TIP
Every life cycle has support for children except for handle
Name
Measuring functions by index can be hard to trace back to the function code, that's why trace provides a name property to easily identify the function by name.
import { Elysia } from 'elysia'

const app = new Elysia()
	.trace(async ({ beforeHandle }) => {
        const { children } = await beforeHandle

		for (const child of children) {
			const { name } = await child

			console.log(name)
            // setup
            // anonymous
		}
	})
	.get('/', () => 'Hi', {
		beforeHandle: [
			function setup() {},
			() => {}
		]
	})
	.listen(3000)
TIP
If you are using an arrow function or unnamed function, name will become "anonymous"
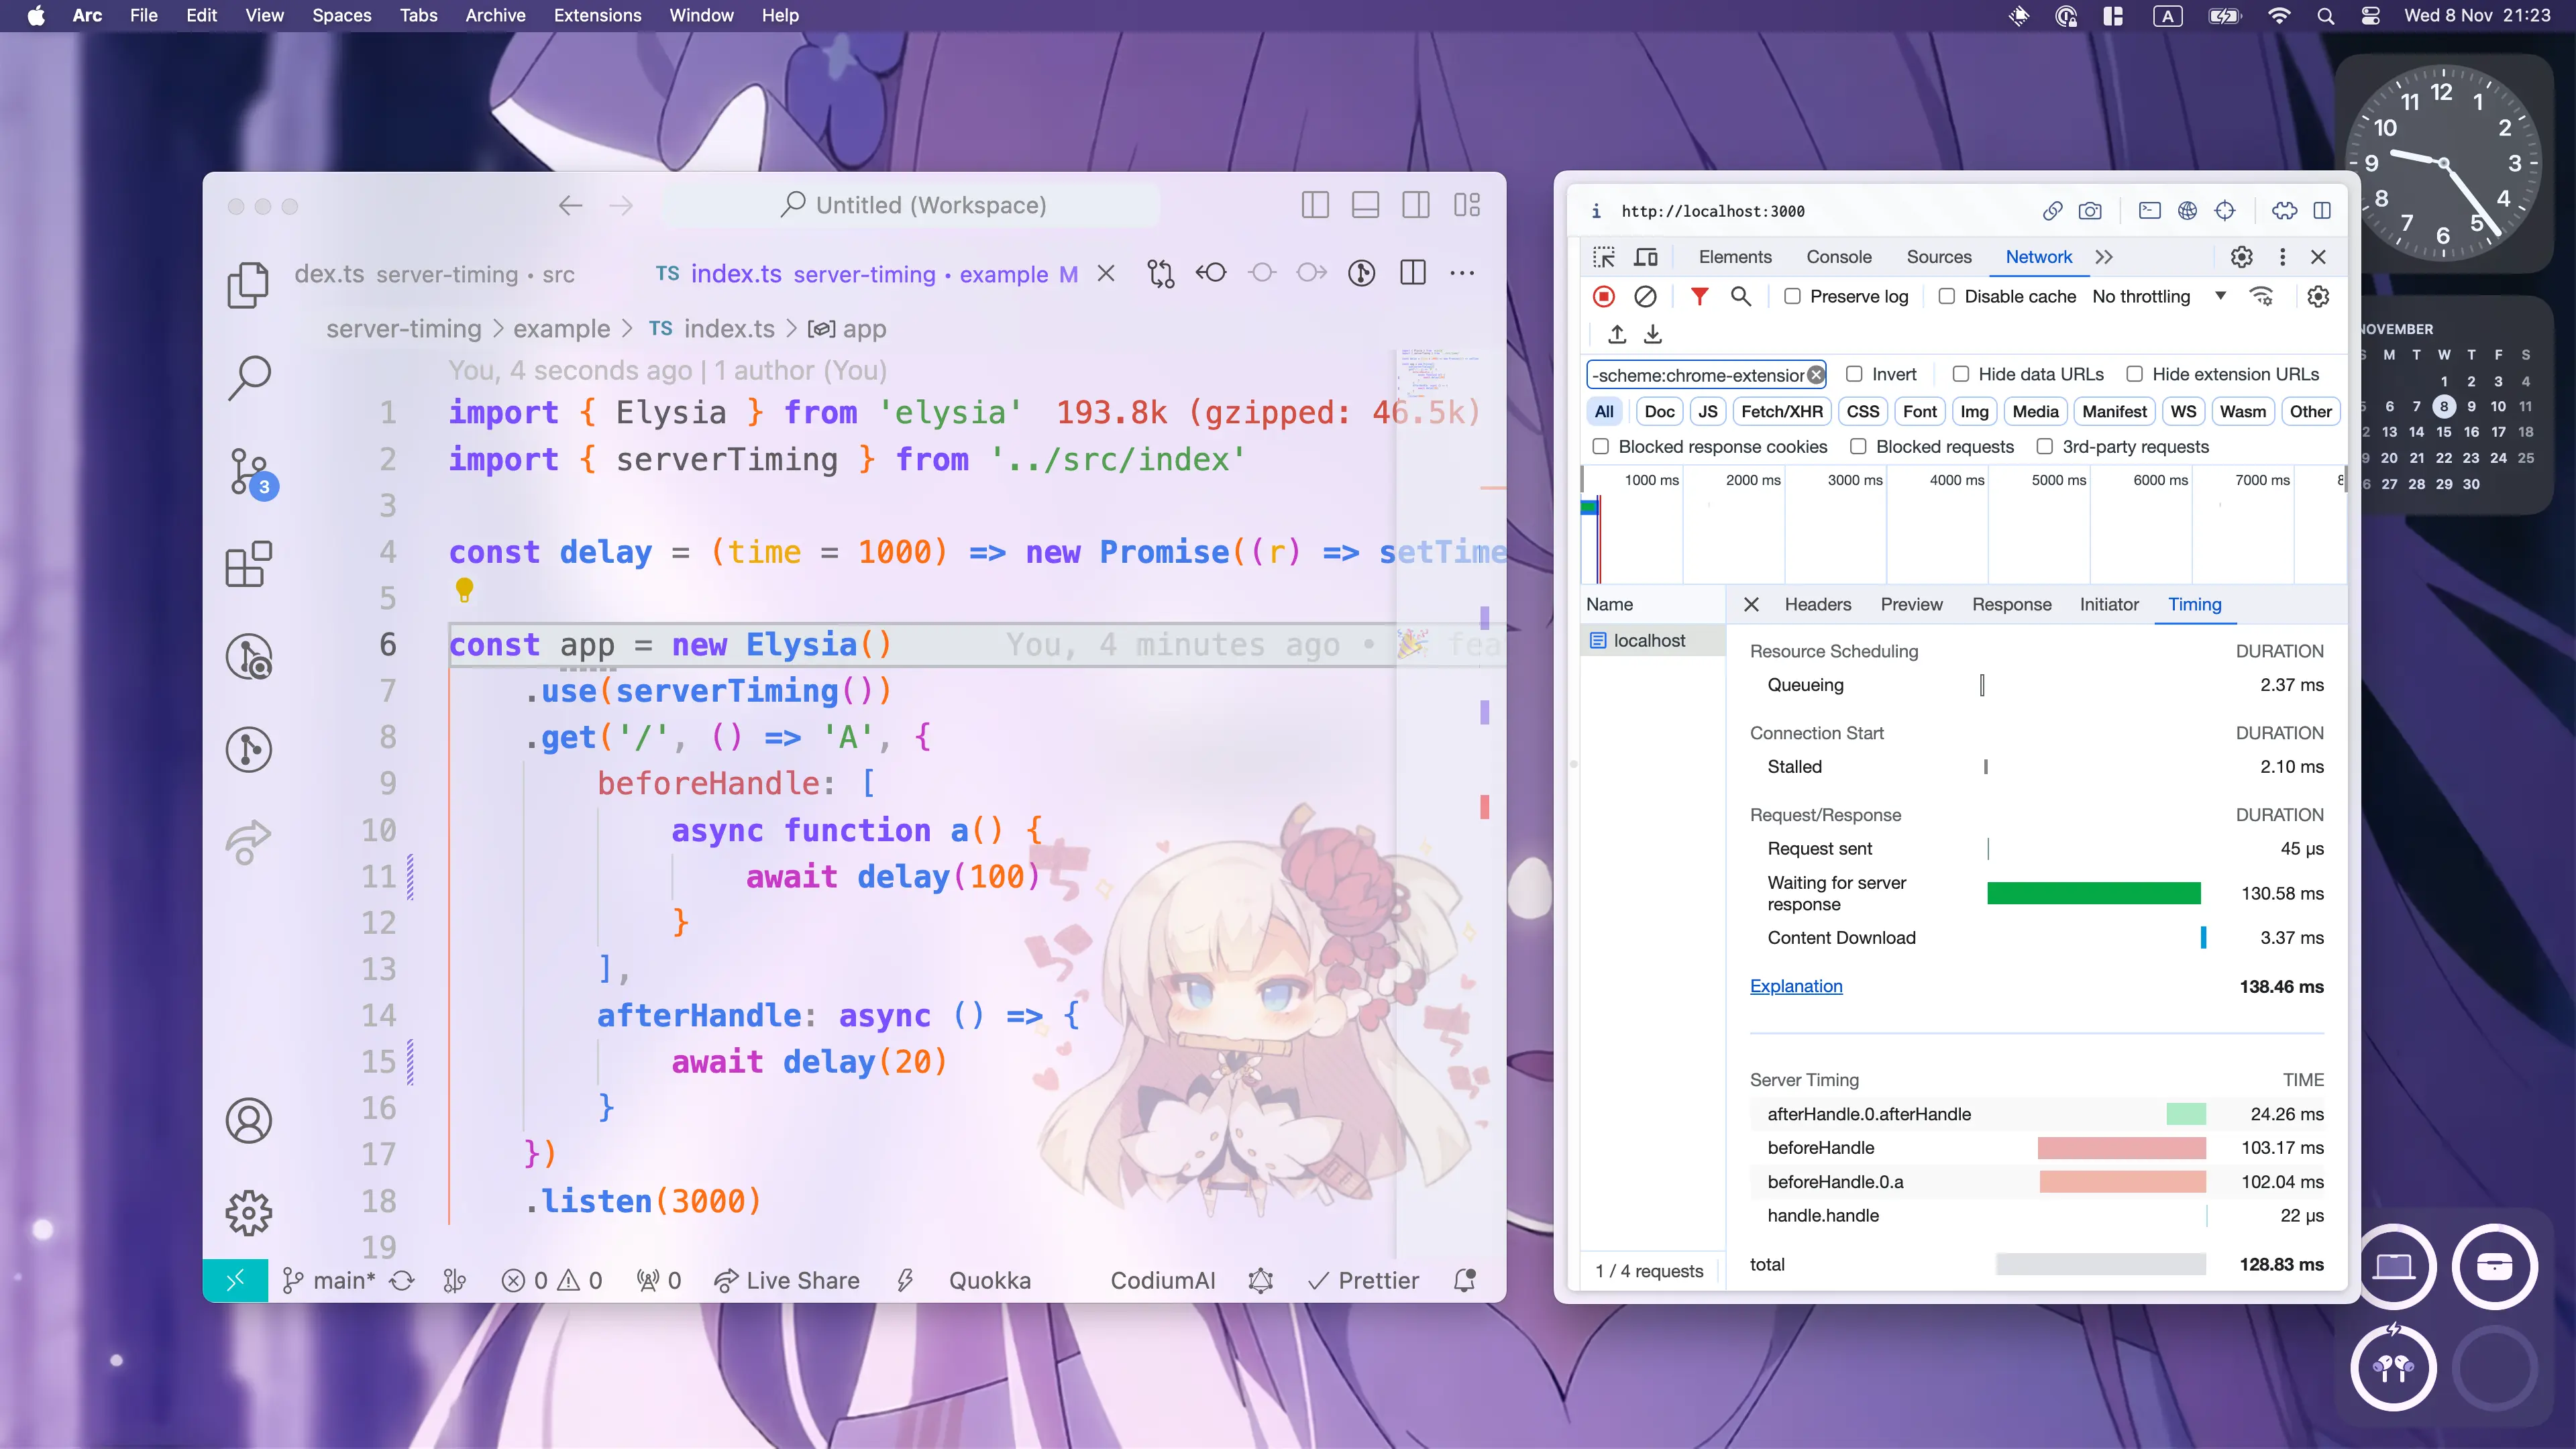
Set
Inside the trace callback, you can access Context of the request, and can mutate the value of the request itself, for example using set.headers to update headers.
This is useful when you need support an API like Server-Timing.
import { Elysia } from 'elysia'

const app = new Elysia()
    .trace(async ({ handle, set }) => {
        const { time, end } = await handle

        set.headers['Server-Timing'] = `handle;dur=${(await end) - time}`
    })
    .get('/', () => 'Hi')
    .listen(3000)
TIP
Using set inside trace can affect performance, as Elysia defers the execution to the next micro-tick.
Skip
Sometimes, beforeHandle or handler can throw an error, skipping the execution of some lifecycles.
By default if this happens, each life-cycle will be resolved automatically, and you can track if the API is executed or not by using skip property
import { Elysia } from 'elysia'

const app = new Elysia()
    .trace(async ({ handle, set }) => {
        const { time, end, skip } = await handle

        console.log(skip)
    })
    .get('/', () => 'Hi', {
        beforeHandle() {
            throw new Error("I'm a teapot")
        }
    })
    .listen(3000)