
OpenTelemetry
To start using OpenTelemetry, install @elysiajs/opentelemetry and apply plugin to any instance.
import { Elysia } from 'elysia'
import { opentelemetry } from '@elysiajs/opentelemetry'

import { BatchSpanProcessor } from '@opentelemetry/sdk-trace-node'
import { OTLPTraceExporter } from '@opentelemetry/exporter-trace-otlp-proto'

new Elysia()
	.use(
		opentelemetry({
			spanProcessors: [
				new BatchSpanProcessor(
					new OTLPTraceExporter()
				)
			]
		})
	)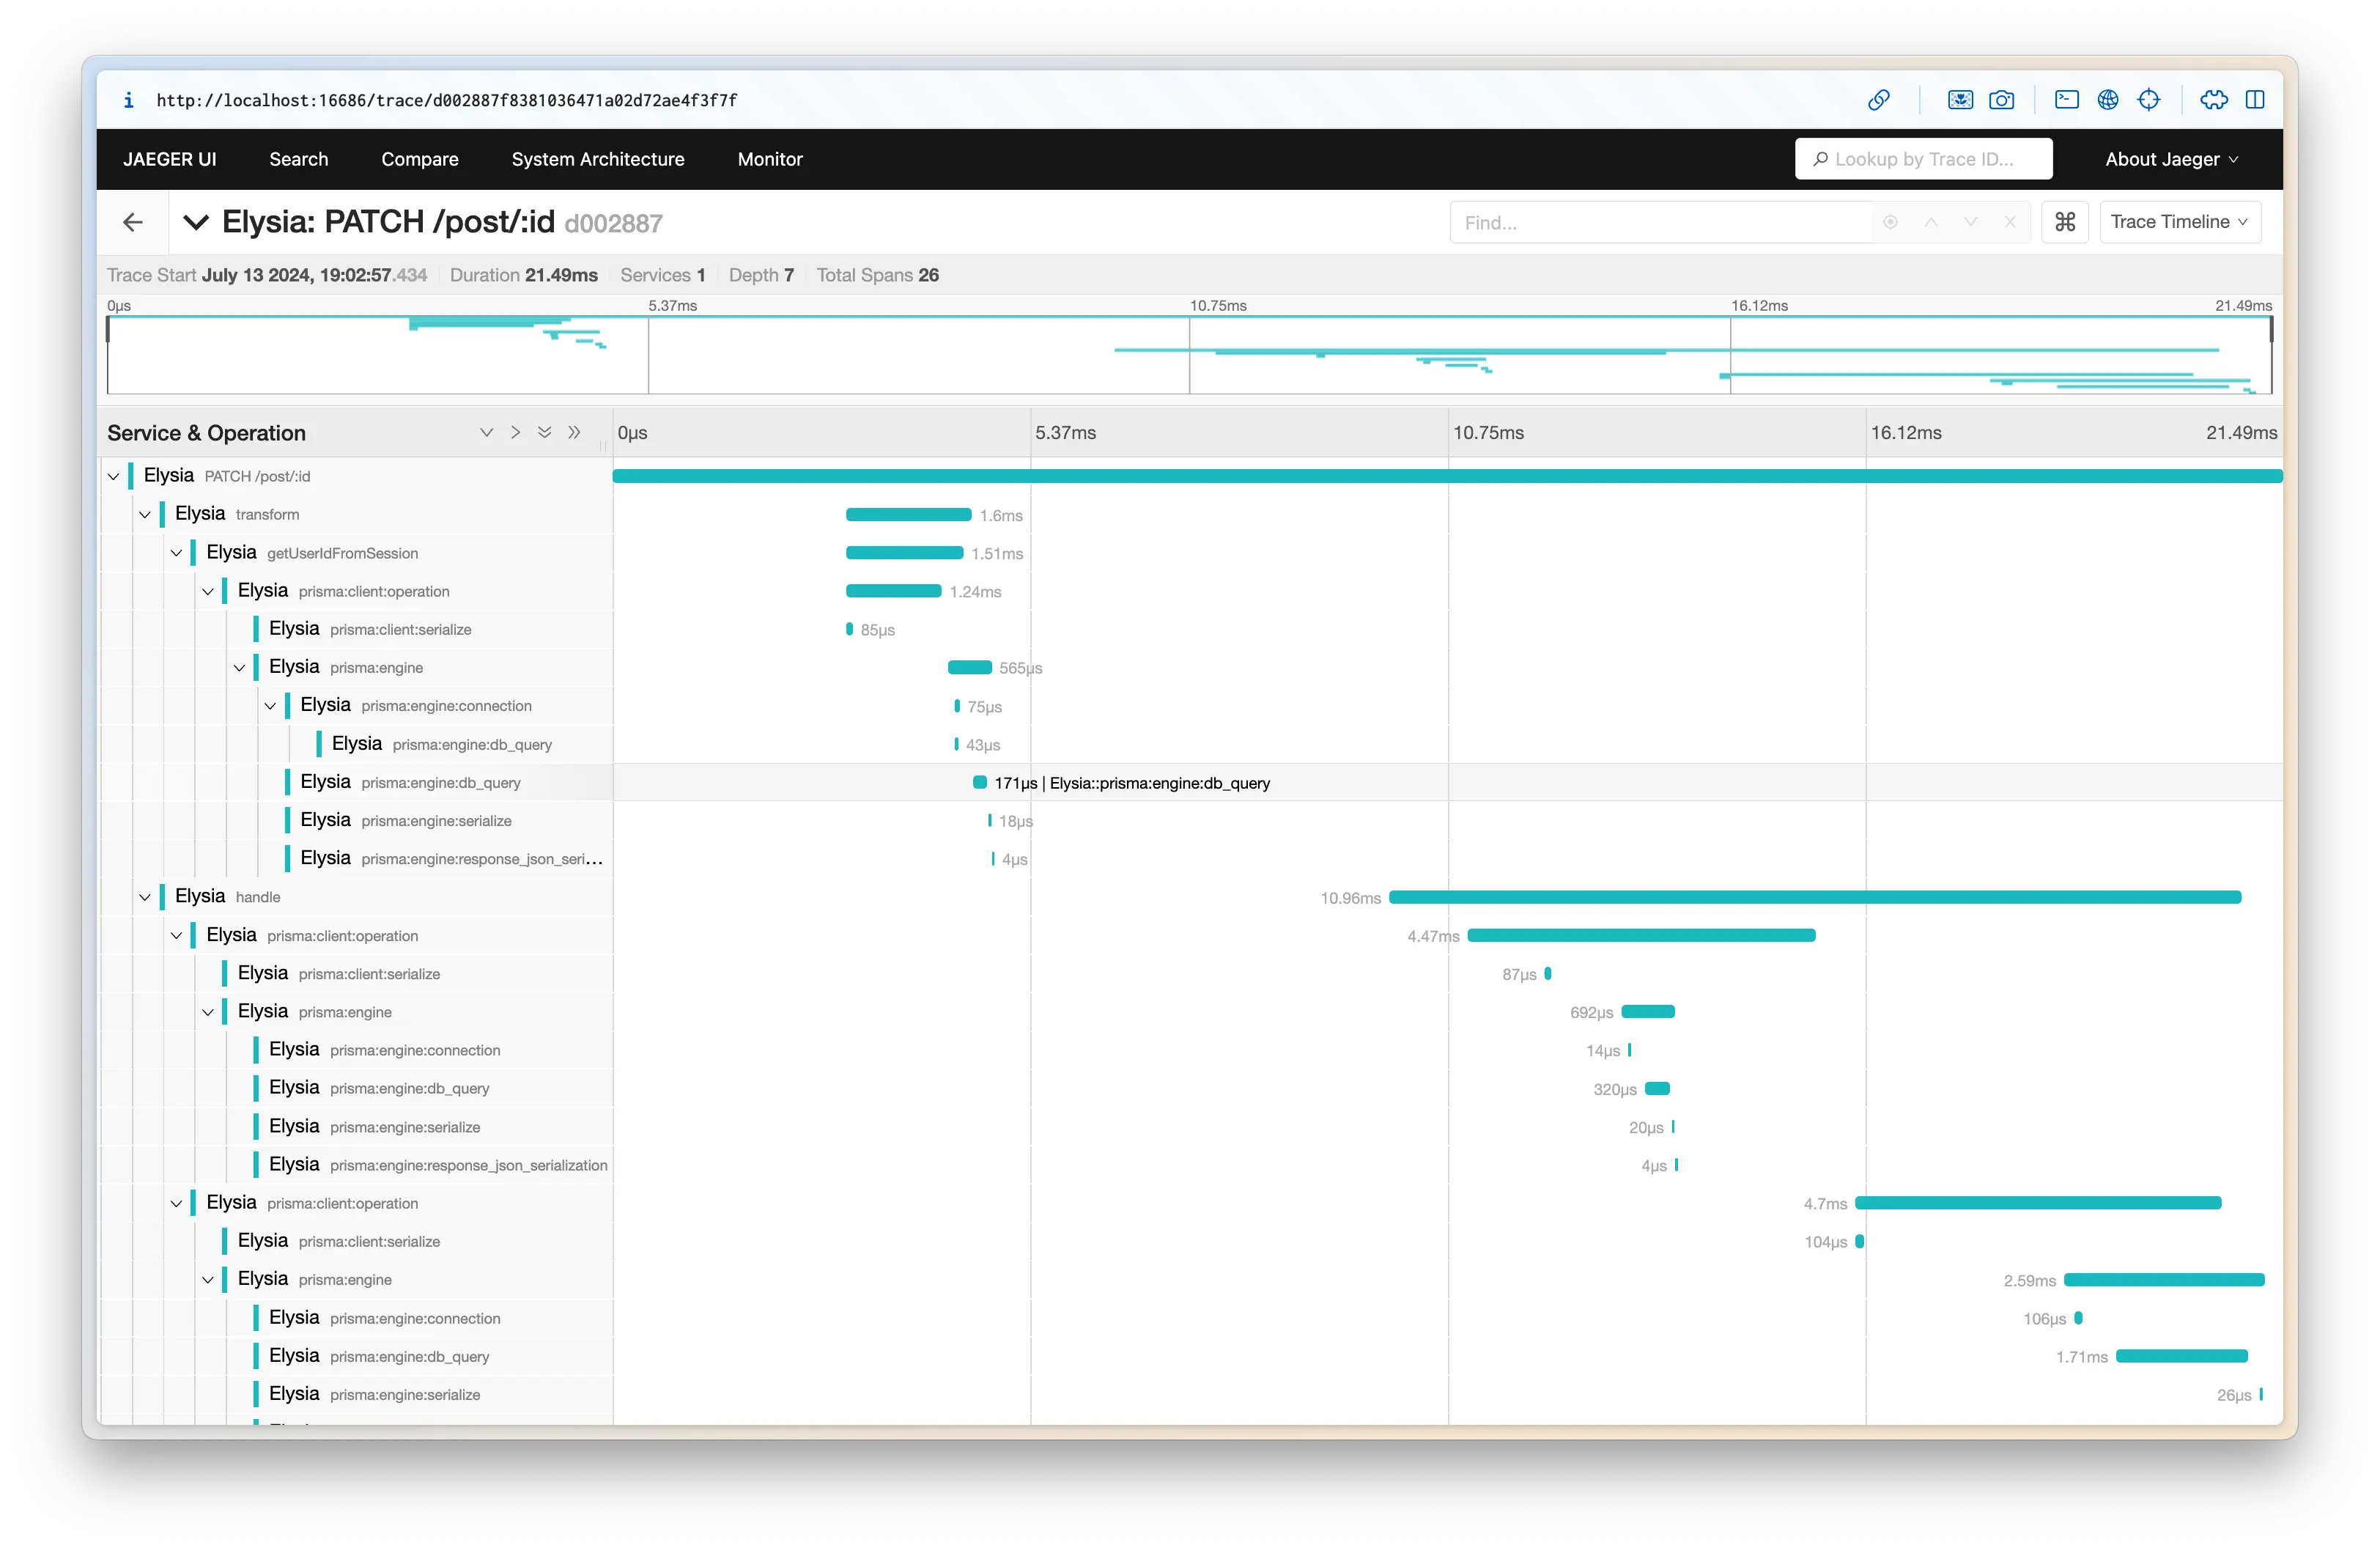
Elysia OpenTelemetry is will collect span of any library compatible OpenTelemetry standard, and will apply parent and child span automatically.
In the code above, we apply Prisma to trace how long each query took.
By applying OpenTelemetry, Elysia will then:
- collect telemetry data
- Grouping relevant lifecycle together
- Measure how long each function took
- Instrument HTTP request and response
- Collect error and exception
You may export telemetry data to Jaeger, Zipkin, New Relic, Axiom or any other OpenTelemetry compatible backend.
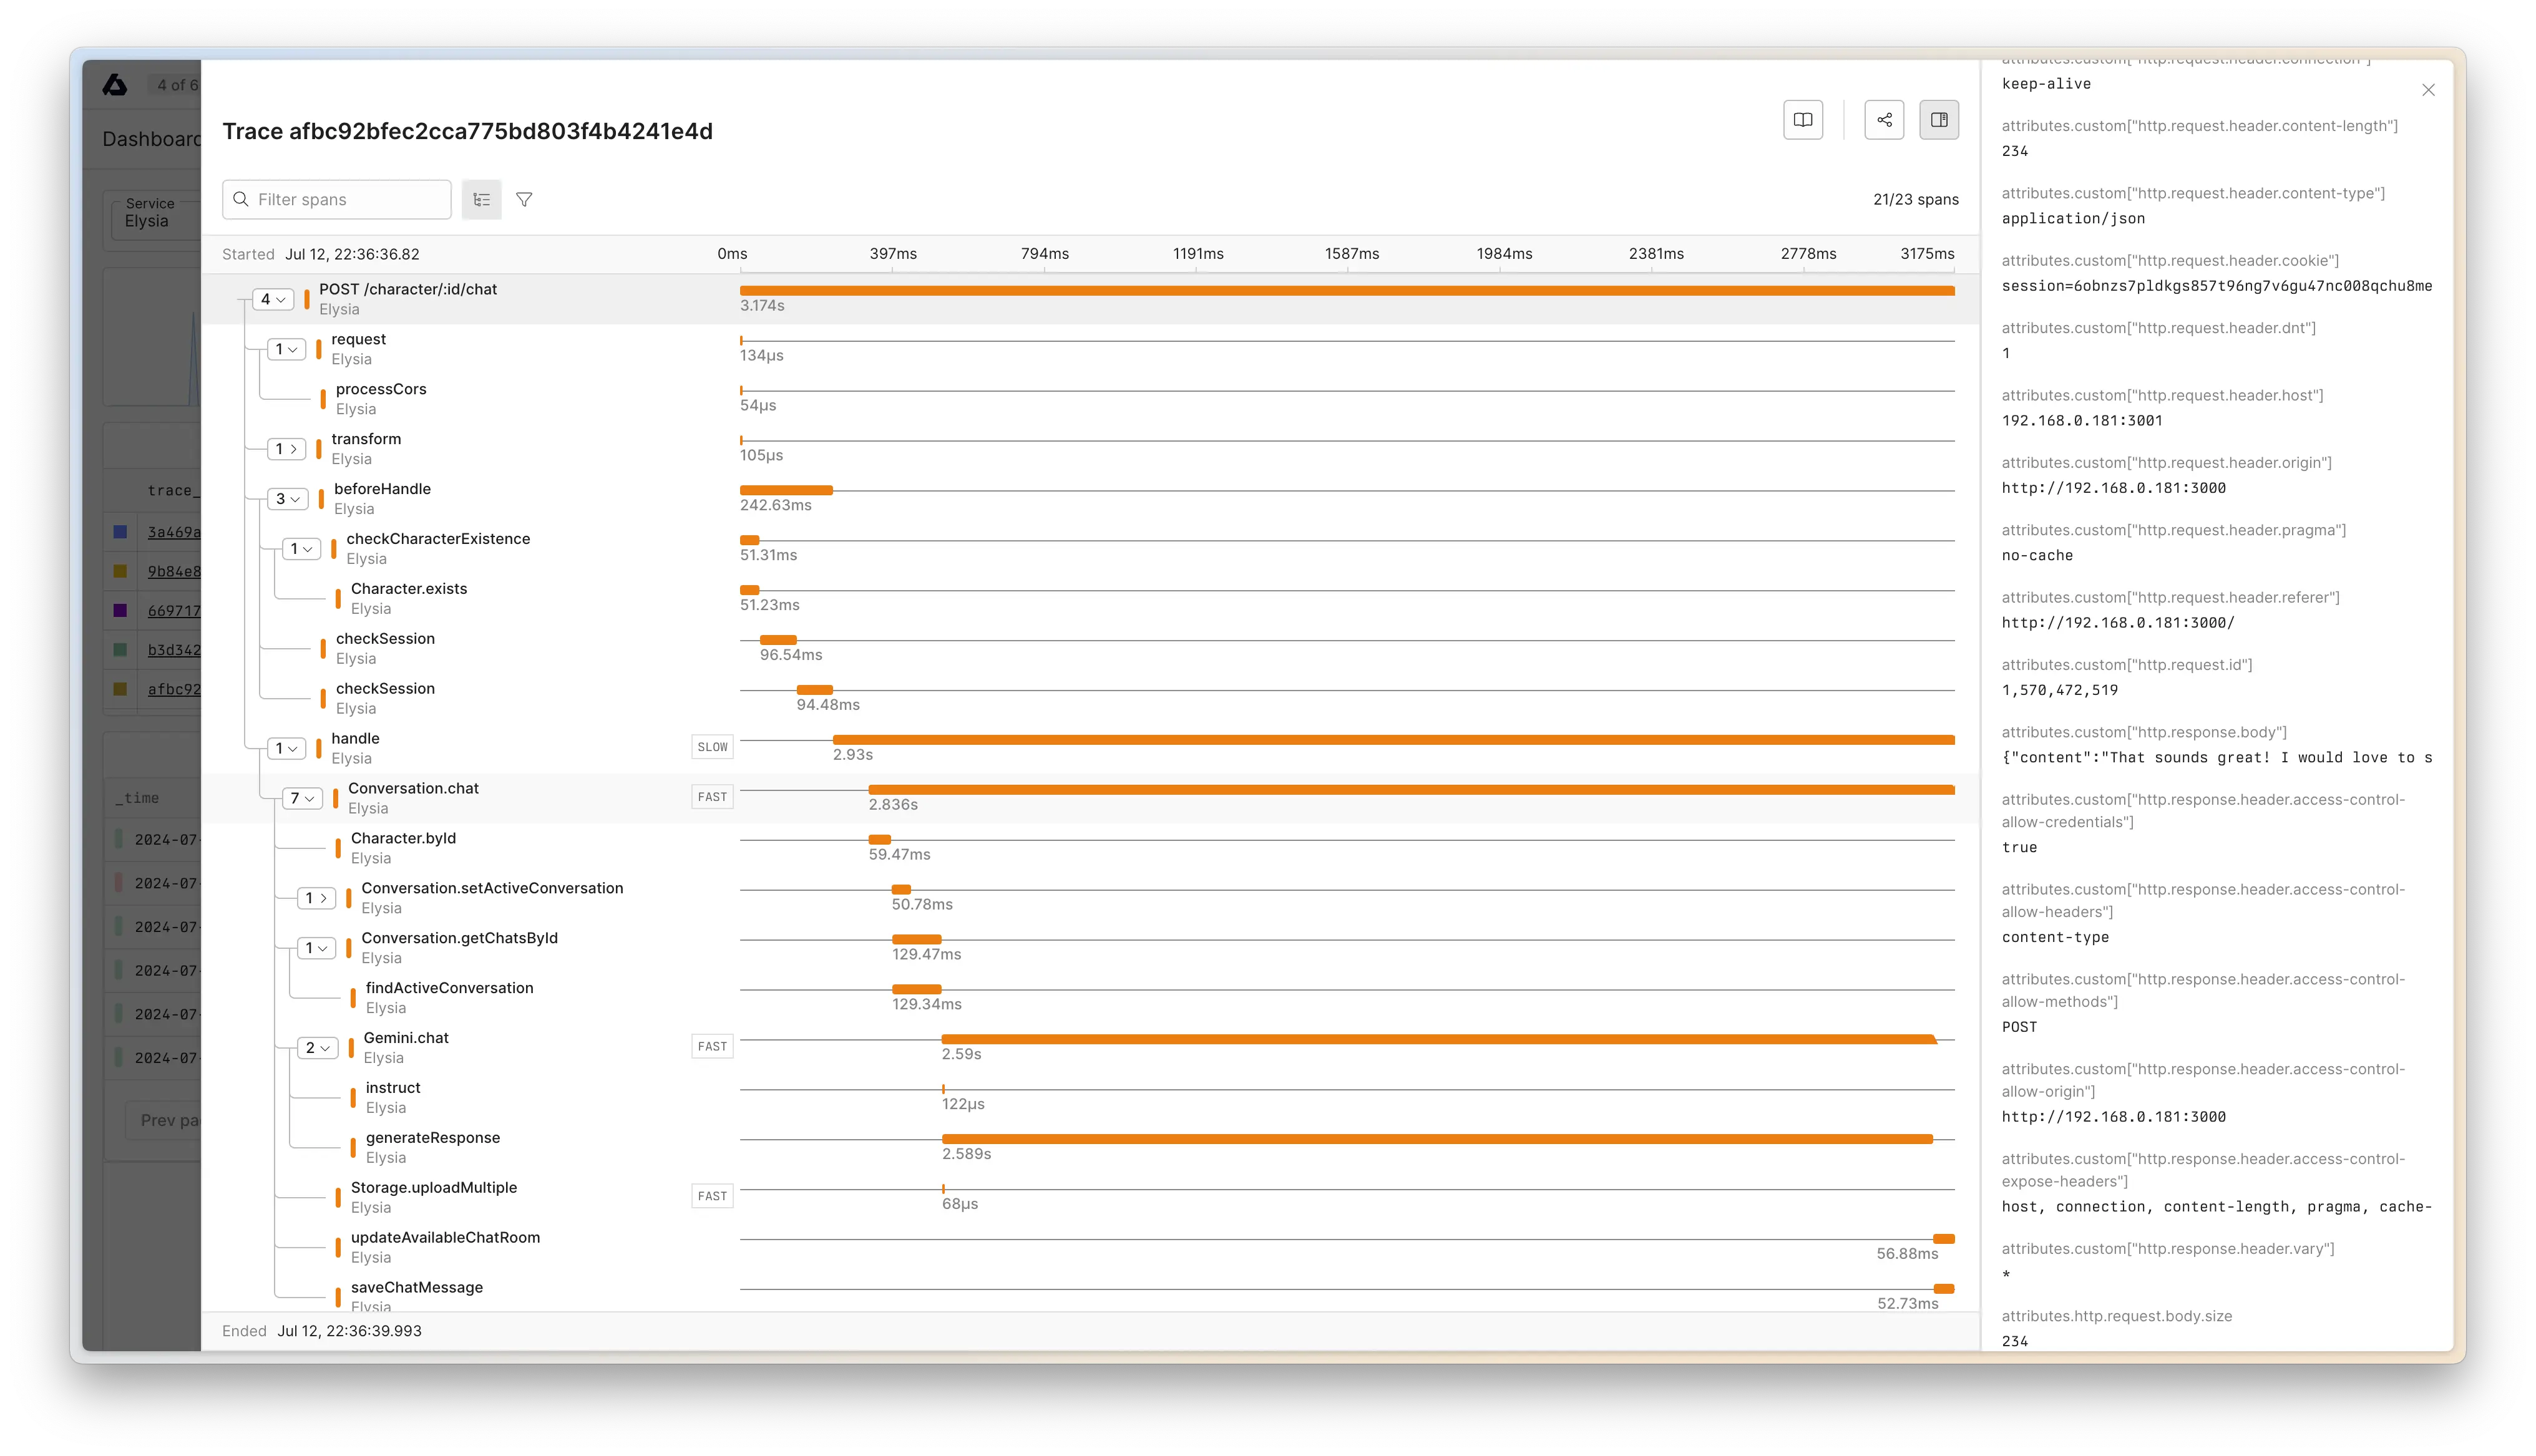
Here's an example of exporting telemetry to Axiom
import { Elysia } from 'elysia'
import { opentelemetry } from '@elysiajs/opentelemetry'

import { BatchSpanProcessor } from '@opentelemetry/sdk-trace-node'
import { OTLPTraceExporter } from '@opentelemetry/exporter-trace-otlp-proto'

new Elysia()
	.use(
		opentelemetry({
			spanProcessors: [
				new BatchSpanProcessor(
					new OTLPTraceExporter({
						url: 'https://api.axiom.co/v1/traces',
						headers: {
						    Authorization: `Bearer ${Bun.env.AXIOM_TOKEN}`,
						    'X-Axiom-Dataset': Bun.env.AXIOM_DATASET
						}
					})
				)
			]
		})
	)
OpenTelemetry SDK
Elysia OpenTelemetry is for applying OpenTelemetry to Elysia server only.
You may use OpenTelemetry SDK normally, and the span is run under Elysia's request span, it will be automatically appear in Elysia trace.
However, we also provide a getTracer, and record utility to collect span from any part of your application.
import { Elysia } from 'elysia'
import { record } from '@elysiajs/opentelemetry'

export const plugin = new Elysia()
	.get('', () => {
		return record('database.query', () => {
			return db.query('SELECT * FROM users')
		})
	})
Record utility
record is an equivalent to OpenTelemetry's startActiveSpan but it will handle auto-closing and capture exception automatically.
You may think of record as a label for your code that will be shown in trace.
Prepare your codebase for observability
Elysia OpenTelemetry will group lifecycle and read the function name of each hook as the name of the span.
It's a good time to name your function.
If your hook handler is an arrow function, you may refactor it to named function to understand the trace better, otherwise your trace span will be named as anonymous.
const bad = new Elysia()
	// ⚠️ span name will be anonymous
	.derive(async ({ cookie: { session } }) => {
		return {
			user: await getProfile(session)
		}
	})

const good = new Elysia()
	// ✅ span name will be getProfile
	.derive(async function getProfile({ cookie: { session } }) {
		return {
			user: await getProfile(session)
		}
	})
getCurrentSpan
getCurrentSpan is a utility to get the current span of the current request when you are outside of the handler.
import { getCurrentSpan } from '@elysiajs/opentelemetry'

function utility() {
	const span = getCurrentSpan()
	span.setAttributes({
		'custom.attribute': 'value'
	})
}
This works outside of the handler by retriving current span from AsyncLocalStorage
setAttribute
setAttribute is a utility to set attribute to the current span.
import { setAttribute } from '@elysiajs/opentelemetry'

function utility() {
	setAttribute('custom.attribute', 'value')
}
This is a syntax sugar for getCurrentSpan().setAttributes
Configuration
See opentelemetry plugin for configuration option and definition.